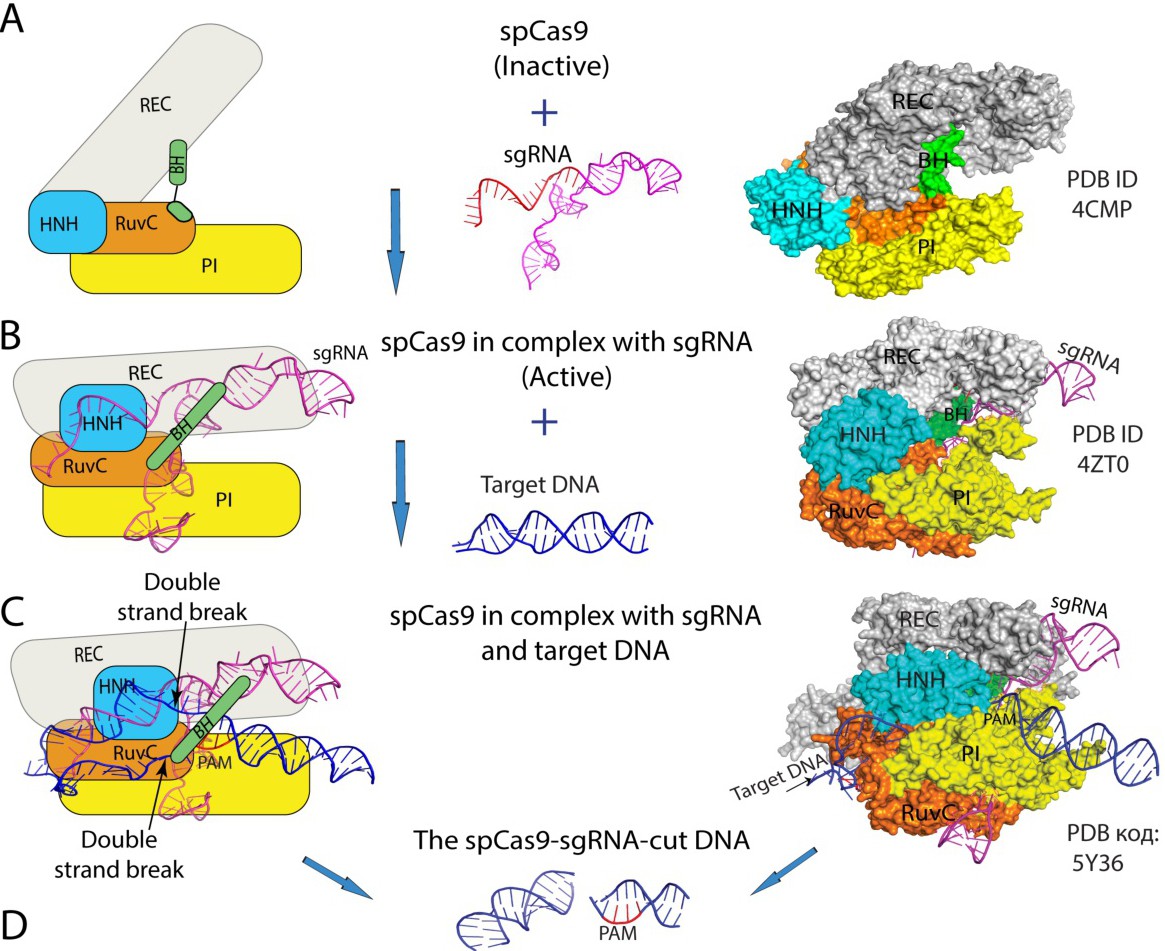
Fig. 3. A. Schematic illustration of spCas9 inactive form and surface representations of the three-dimensional structure of spCas9 ID 4CMP from PDB database. B. Schematic illustration of three-dimensional structure of complex spCas9 active form with sgRNA and its surface representations (ID 4ZT0 from PDB database). C. Schematic illustration of three-dimensional structure of complex spCas9 active form with sgRNA and target DNA and its surface representations (ID 5Y36 from PDB database). D. Cartoon representation of the spCas9-sgRNA-cut three-dimensional structure of DNA ID 5Y36 from PDB database. All crystal structural images were visualized with the PyMOL Molecular Graphics System, Version 2.0 Schrödinger, LLC and Adobe Illustrator.